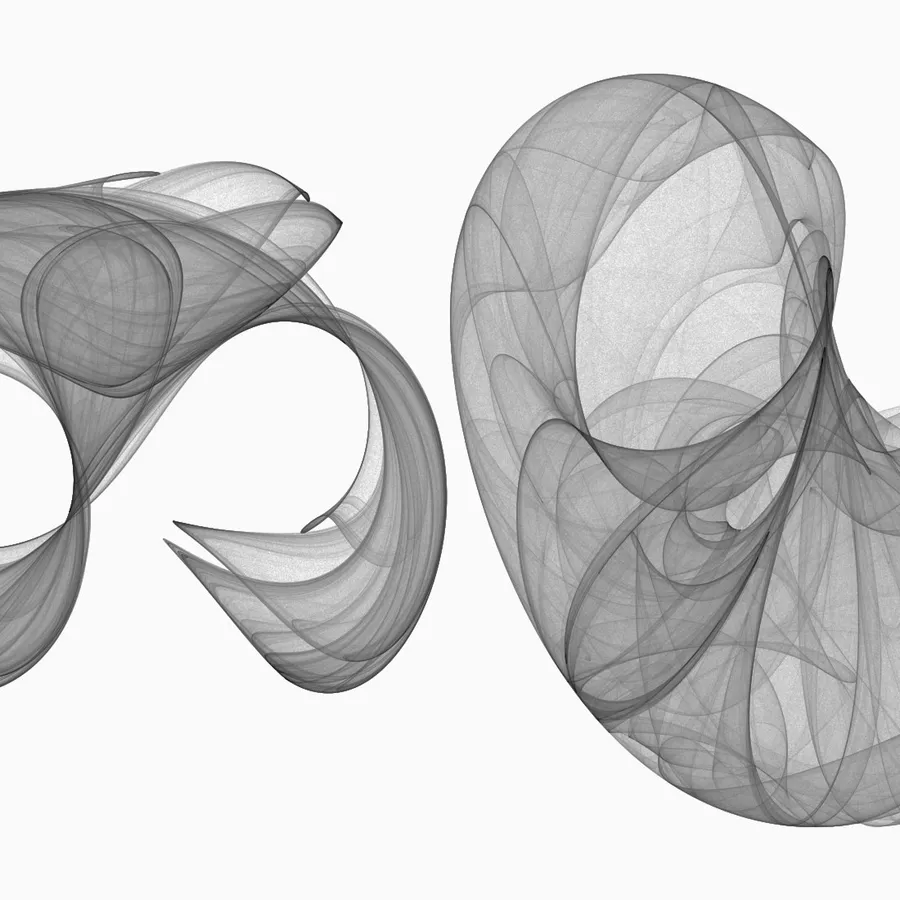
Millions of points, two lines of trigonometry.
So far every attractor in the lab has been a continuous flow, a set of differential equations integrated step by step through time.
Clifford Pickover’s and Peter de Jong’s attractors are something different: iterated maps. There is no time step and no integration. Each point is fed straight back into the formula to produce the next one.
A single point means nothing on its own. The shape appears only after millions of iterations, when we count how many times each pixel was visited and map that density to tone. Dense regions turn dark and sparse ones fade away, giving the attractors their silky, almost photographic texture.
The algorithm
javascript·clifford.js
const [a, b, c, d] = [-1.4, 1.6, 1.0, 0.7];

const next = (x,y) => ({
  x: Math.sin(a * y) + c * Math.cos(a * x),
  y: Math.sin(b * x) + d * Math.cos(b * y),
});
javascript·de-jong.js
const [a, b, c, d] = [1.4, -2.3, 2.4, -2.1];

const next = (x,y) => ({
  x: Math.sin(a * y) - Math.cos(b * x),
  y: Math.sin(c * x) - Math.cos(d * y),
});
Rendering the density
javascript·density.js
const density = new Float32Array(W * H);
let p = {x: 0.1, y: 0.1};

for (let i = 0; i < 10_000_000; i++) {
  p = next(p.x, p.y);
  const px = Math.floor(W / 2 + p.x * scale);
  const py = Math.floor(H / 2 - p.y * scale);
  density[py * W + px] += 1;
}

const max = Math.max(...density);
// Log scale keeps the faint outer veils visible next to the dense core
const tone = (v) => Math.log1p(v) / Math.log1p(max);
Every combination of a, b, c and d gives a different shape. Most of them collapse into a few dots, but a surprising number of random values produce something worth printing.
References